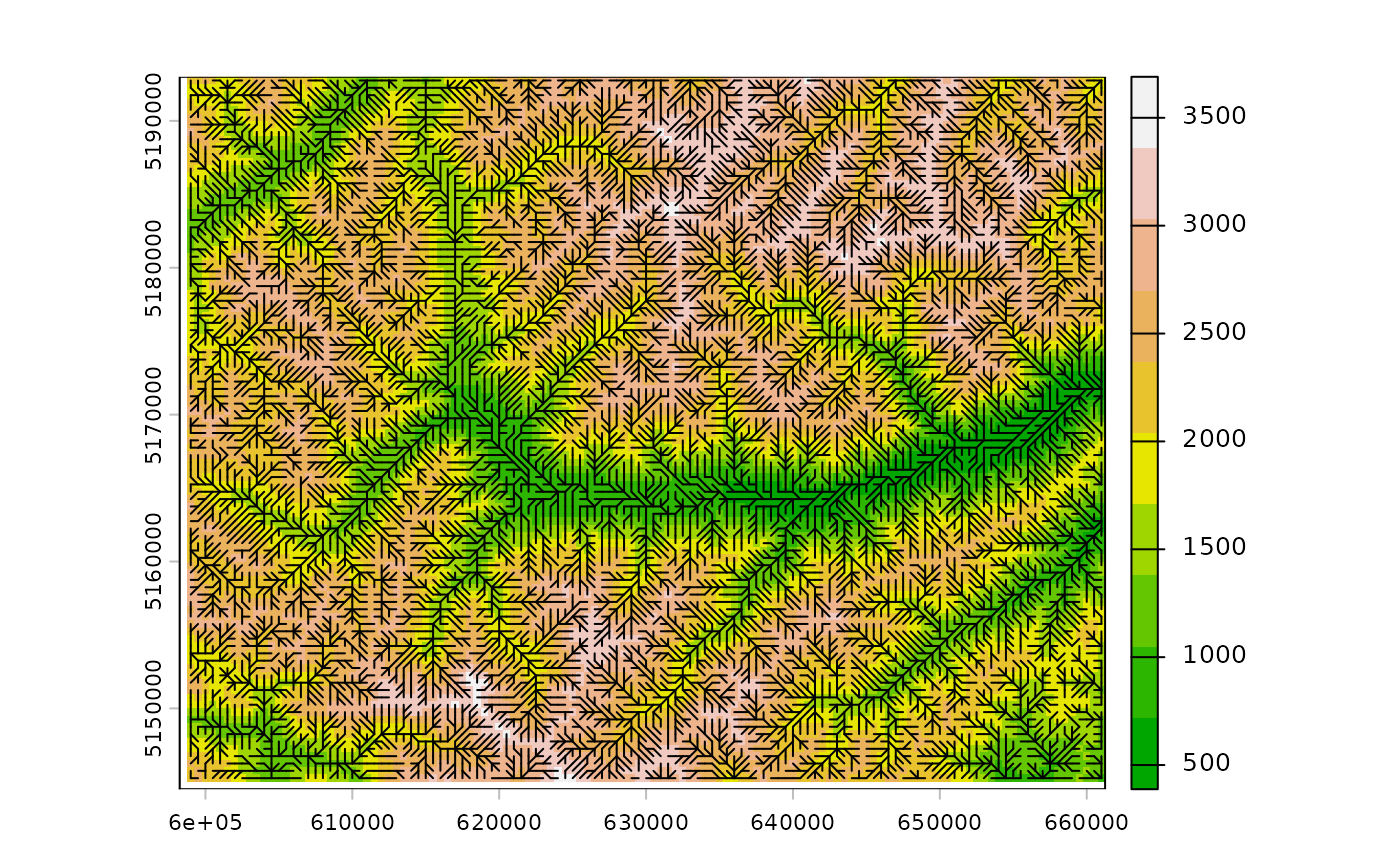
Add directional arrows from a SpatRaster to a plot
as.arrows.RdCreate directional arrows and add these to a plot, typically used to represent vector fields such as wind directions, drainage flow directions, or other angular data.
Usage
as.arrows(x, unit=c("degrees", "radians", "flowdir"),
       arrow_length=NA,clockwise=FALSE, angle_from_h_axis=0,
       angle_from_x_axis=angle_from_h_axis, length=0,...)
Arguments
- x
SpatRaster with values representing angles or directions
- unit
Character. Unit of the angle values in
x. One of"degrees","radians"or"flowdir". Seeterrainforflowdir- arrow_length
Numeric. Length of the arrows to be plotted
- clockwise
Logical. Default is
FALSE. IfTRUE, angles measured in radians or degrees are considered clockwise- angle_from_x_axis
Anti-clockwise angle from x (or horizontal) axis to the reference direction
- angle_from_h_axis
Anti-clockwise angle from x (or horizontal) axis to the reference direction. In the case of northing wind direction it is often used
angle_from_x_axis=90, unit="deg", clockwise=TRUE- length,...
Additional graphical parameters passed to
arrows
Examples
r <- rast(system.file("ex/elev_vinschgau.tif", package="terra"))
r <- aggregate(r, fact=2,fun=min)
d <- terrain(r, "flowdir")

plot(r,col=terrain.colors(10))
as.arrows(d, unit="flowdir", col="black")