Cartogram
cartogram.RdMake a cartogram, that is, a map where the area of polygons is made proportional to another variable. This can be a good way to map raw count data (e.g. votes).
Examples
f <- system.file("ex/lux.shp", package="terra")
v <- vect(f)
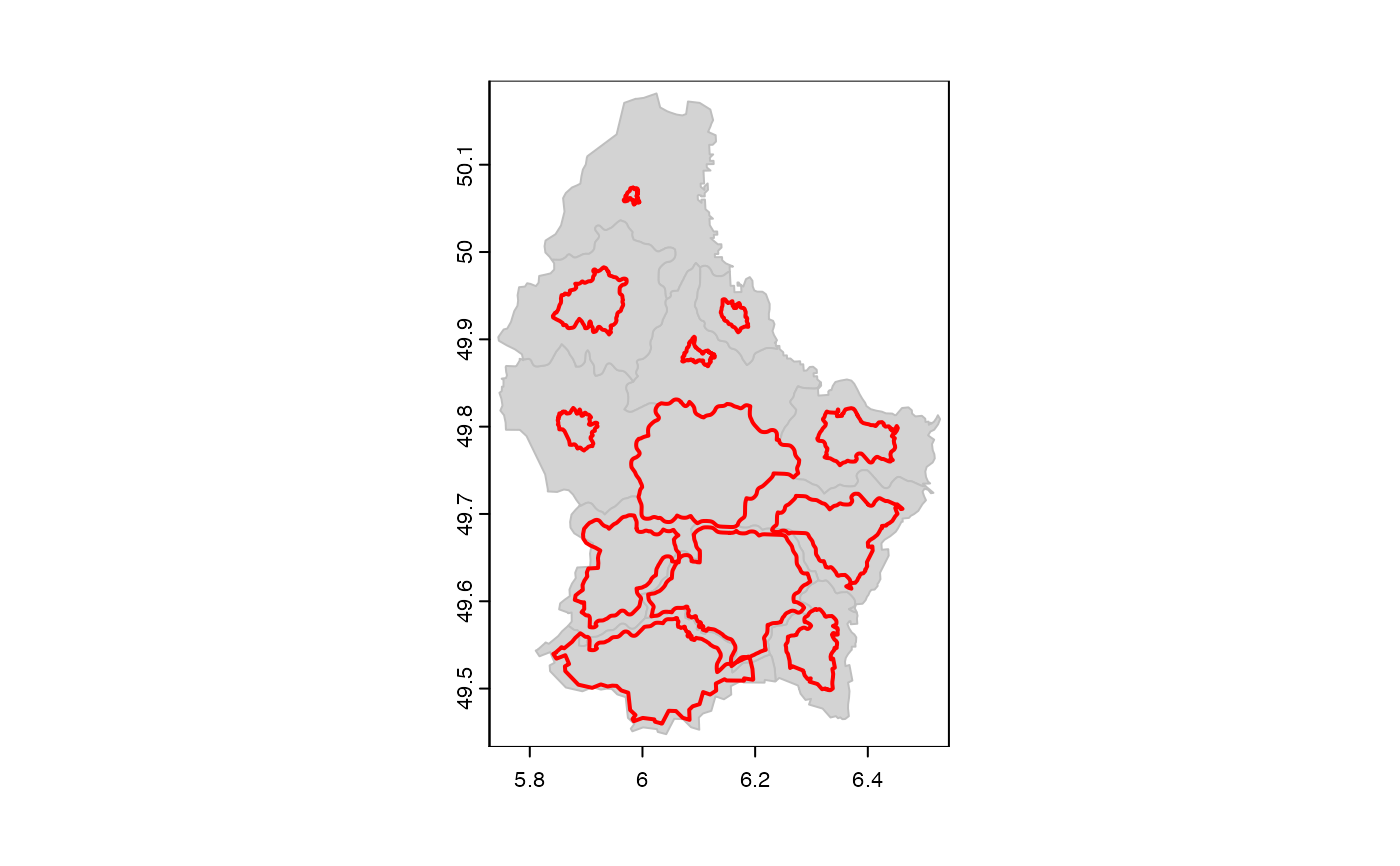
v$value <- 1:12
pnc <- cartogram(v, "value", "nc")
pcirc <- cartogram(v, "value", "circles")
plot(v, col="light gray", border="gray")
lines(pnc, col="red", lwd=2)
lines(pcirc, col="blue", lwd=2)