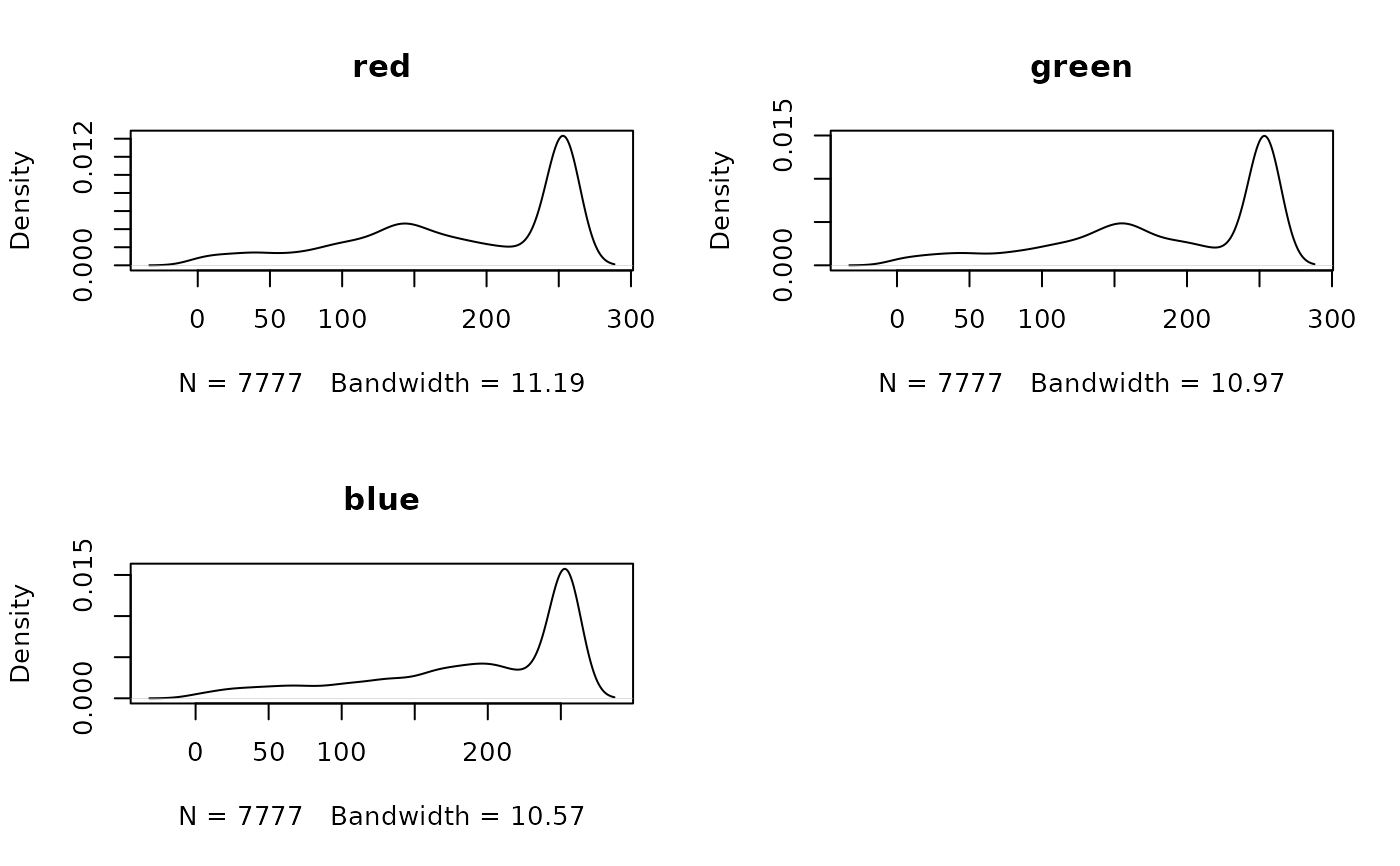
Density plot
density.RdCreate density plots of the cell values of a SpatRaster
Arguments
- x
SpatRaster
- maxcells
the maximum number of (randomly sampled) cells to be used for creating the plot
- plot
if
TRUEproduce a plot, else return a density object- main
character. Caption of plot(s)
- ...
additional arguments passed to
plot
Examples
logo <- rast(system.file("ex/logo.tif", package="terra"))
density(logo)