Focal function across two layers
focalPairs.RdCalculate values such as a correlation coefficient for focal regions in two neighboring layers. A function is applied to the first and second layer, then to the second and third layer, etc.
Usage
# S4 method for class 'SpatRaster'
focalPairs(x, w=3, fun, ..., fillvalue=NA,
    filename="", overwrite=FALSE, wopt=list())
Arguments
- x
SpatRaster with at least two layers
- w
numeric or matrix to define the focal window. The window an be defined as one (for a square) or two numbers (row, col); or with an odd-sized weights matrix. See the Details section in
focal. Note that if a matrix with numbers other than zero or one are used, the values are used as weights. For this to work,funmust have an argumentweights- fun
a function with at least two arguments (one for each layer). There is a built-in function "pearson" (for both the weighted and the unweighted Pearson correlation coefficient. This function has an additional argument
na.rm=FALSE- ...
additional arguments for
fun- fillvalue
numeric. The value of the cells in the virtual rows and columns outside of the raster
- filename
character. Output filename
- overwrite
logical. If
TRUE,filenameis overwritten- wopt
additional arguments for writing files as in
writeRaster
Examples
r <- rast(system.file("ex/logo.tif", package="terra"))
set.seed(0)
r[[1]] <- flip(r[[1]], "horizontal")
r[[2]] <- flip(r[[2]], "vertical") + init(rast(r,1), runif)
r[[3]] <- init(rast(r,1), runif)
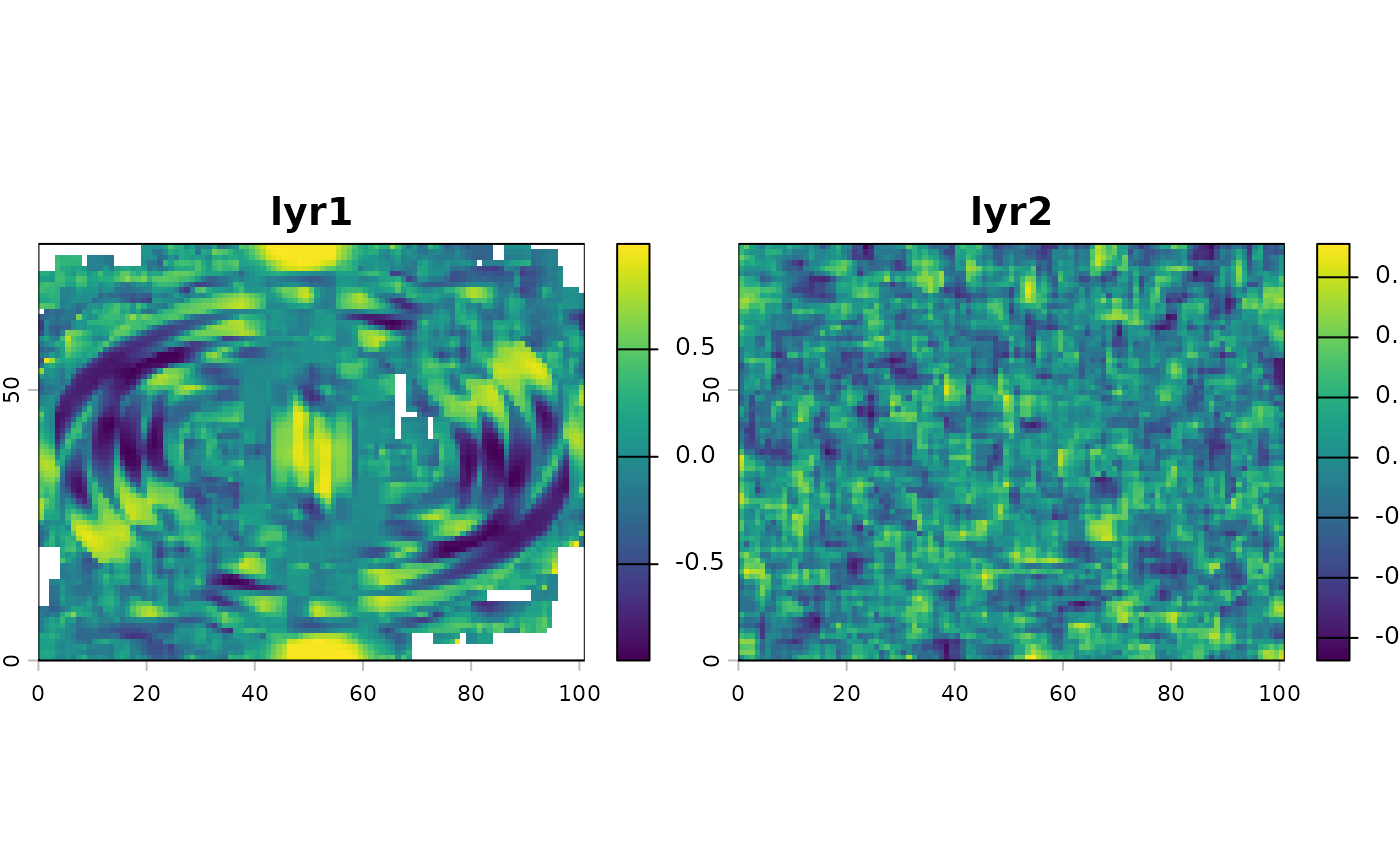
x <- focalPairs(r, w=5, "pearson", na.rm=TRUE)
plot(x)
 # suppress warning "the standard deviation is zero"
suppressWarnings(x <- focalPairs(r, w=5, "pearson", use="complete.obs"))
z <- focalPairs(r, w=9, function(x, y) mean(x) + mean(y))
# suppress warning "the standard deviation is zero"
suppressWarnings(x <- focalPairs(r, w=5, "pearson", use="complete.obs"))
z <- focalPairs(r, w=9, function(x, y) mean(x) + mean(y))