SpatRaster image method
image.RdPlot (make a map of) the values of a SpatRaster via image. See plot if you need more fancy options such as a legend.
Arguments
- x
SpatRaster
- y
positive integer indicating the layer to be plotted, or a character indicating the name of the layer
- maxcell
positive integer. Maximum number of cells to use for the plot
- ...
additional arguments as for
graphics::image
Examples
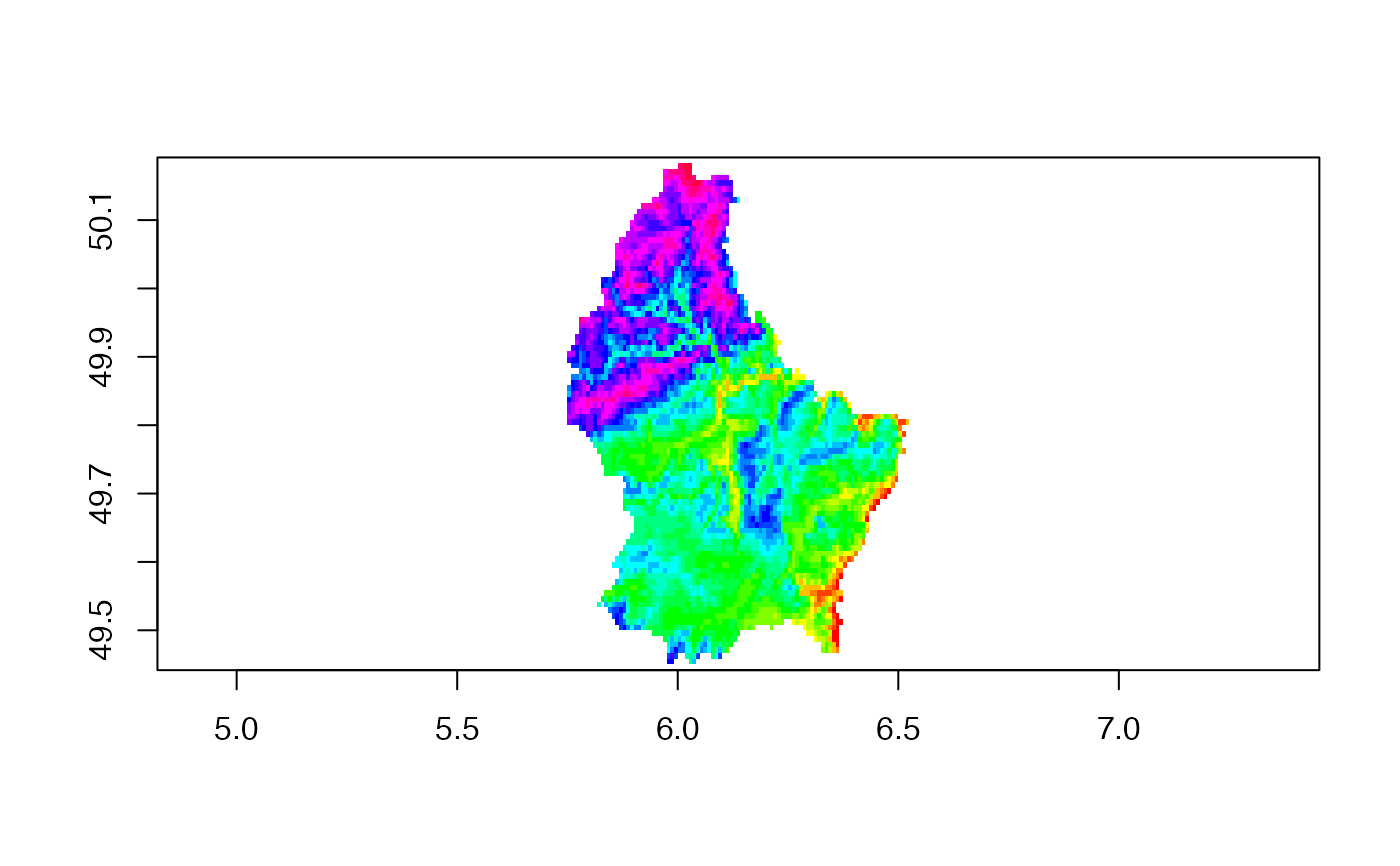
f <- system.file("ex/elev.tif", package="terra")
r <- rast(f)
image(r)

image(r, col=rainbow(24))