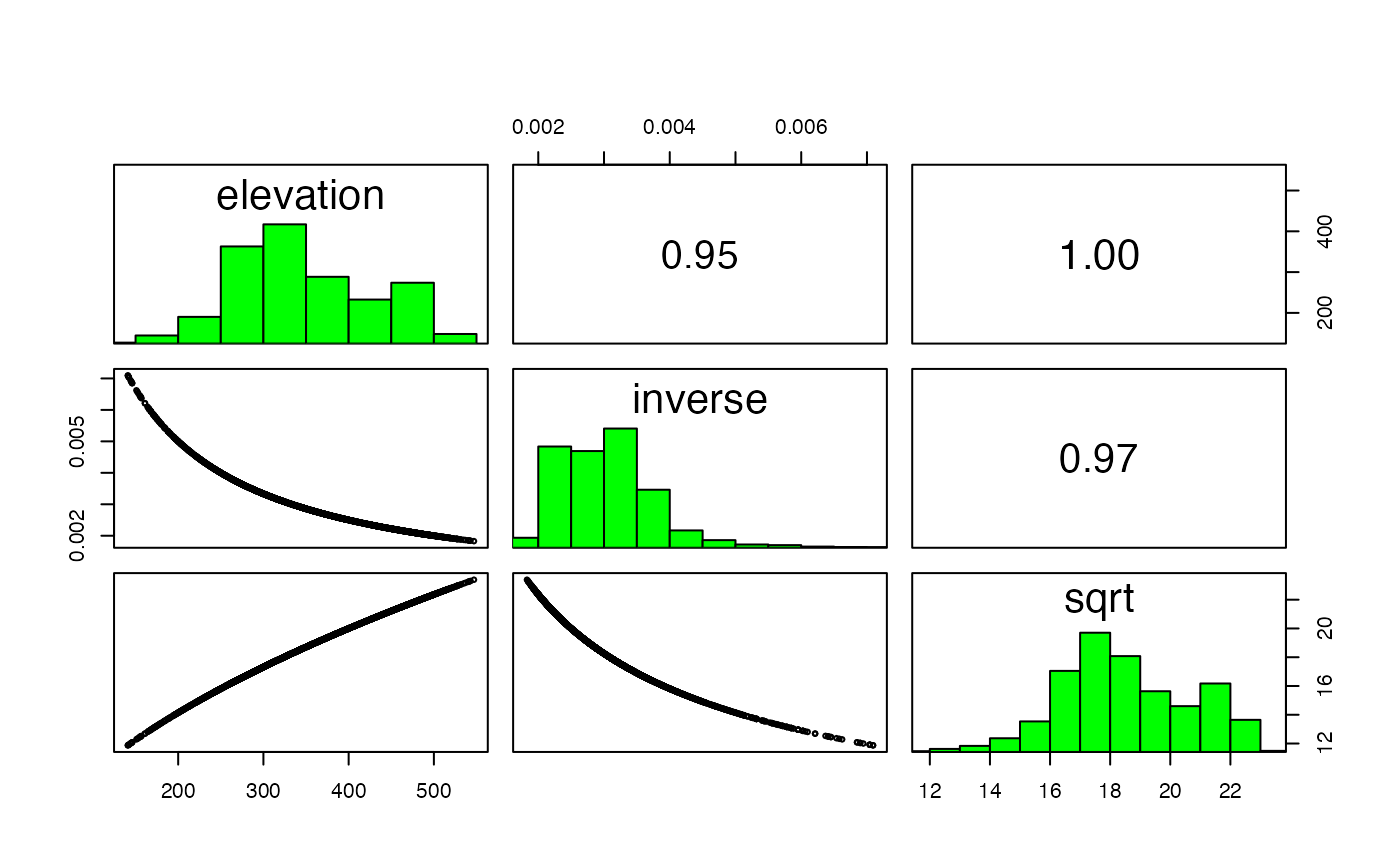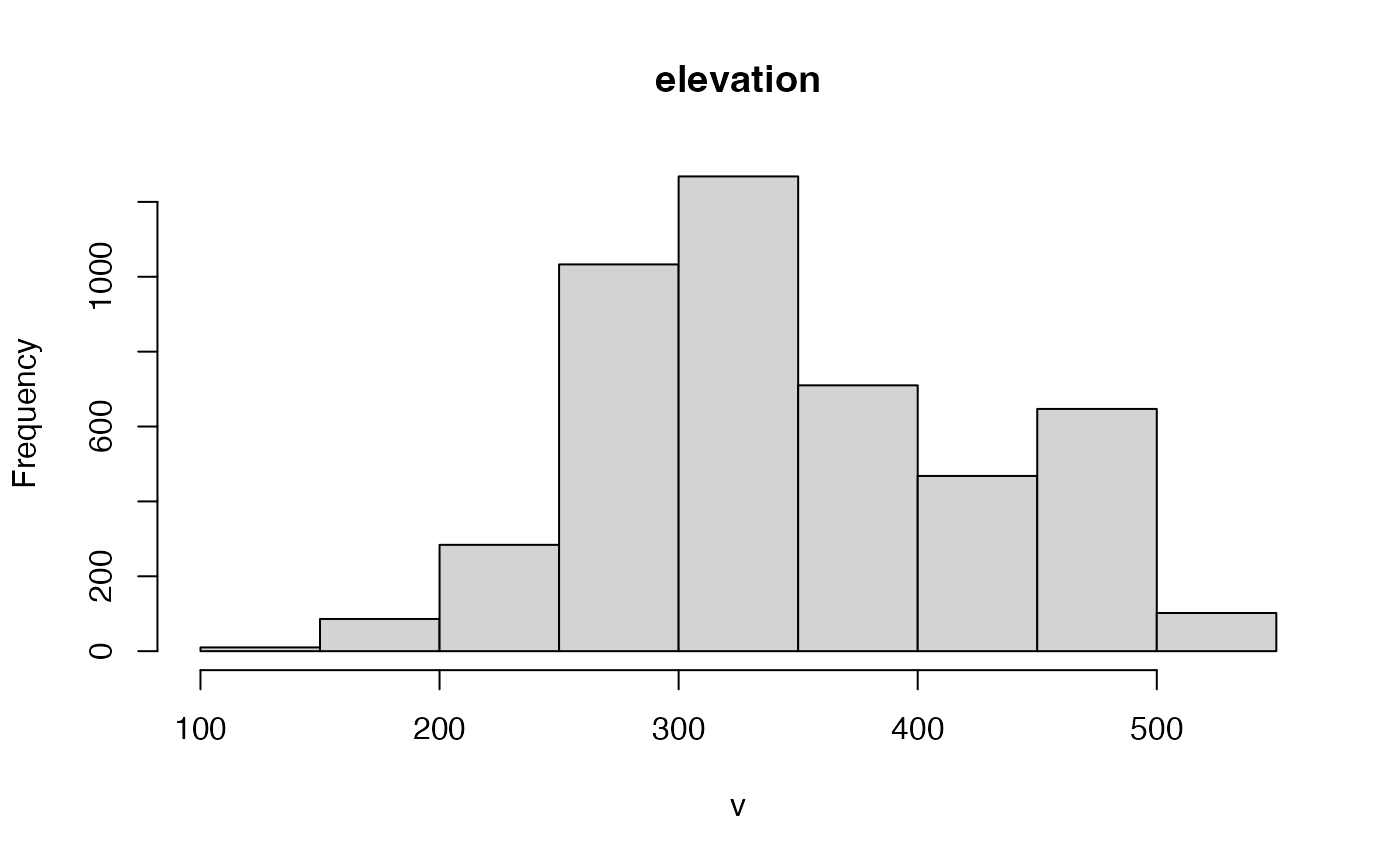
Pairs plot (matrix of scatterplots)
pairs.RdPair plots of layers in a SpatRaster. This is a wrapper around graphics function pairs.
Usage
# S4 method for class 'SpatRaster'
pairs(x, hist=TRUE, cor=TRUE, use="pairwise.complete.obs", maxcells=100000, ...)
Arguments
- x
SpatRaster
- hist
logical. If TRUE a histogram of the values is shown on the diagonal
- cor
logical. If TRUE the correlation coefficient is shown in the upper panels
- use
argument passed to the
corfunction- maxcells
integer. Number of pixels to sample from each layer of a large SpatRaster
- ...
additional arguments (graphical parameters)


