Thresholding
thresh.RdCompute a threshold to divide the values of a SpatRaster into two groups, and use that threshold to classify the raster.
Usage
# S4 method for class 'SpatRaster'
thresh(x, method="otsu", maxcell=1000000, combine=FALSE,
      as.raster=TRUE, filename="", ...)
Arguments
- x
SpatRaster
- method
character. One of "mean", "median" or "otsu" for Otsu's method
- maxcell
positive integer. Maximum number of cells to use to compute the threshold
- combine
logical. If
TRUEthe layers ofxare combined to compute a single threshold- as.raster
logical. If
TRUEa classified SpatRaster is returned. Otherwise the threshold(s) are returned- filename
character. Output filename
- ...
additional arguments for writing files as in
writeRaster
References
Otsu, N. (1979). A Threshold Selection Method from Gray-Level Histograms. IEEE Transactions on Systems, Man, and Cybernetics, 9(1), 62-66. doi:10.1109/TSMC.1979.4310076
Examples
s <- rast(system.file("ex/logo.tif", package="terra"))
thresh(s, "mean", as.raster=FALSE)
#> red green blue
#> 182.2855 185.3509 192.8046
thresh(s, "mean", combine=TRUE, as.raster=FALSE)
#> [1] 186.8136
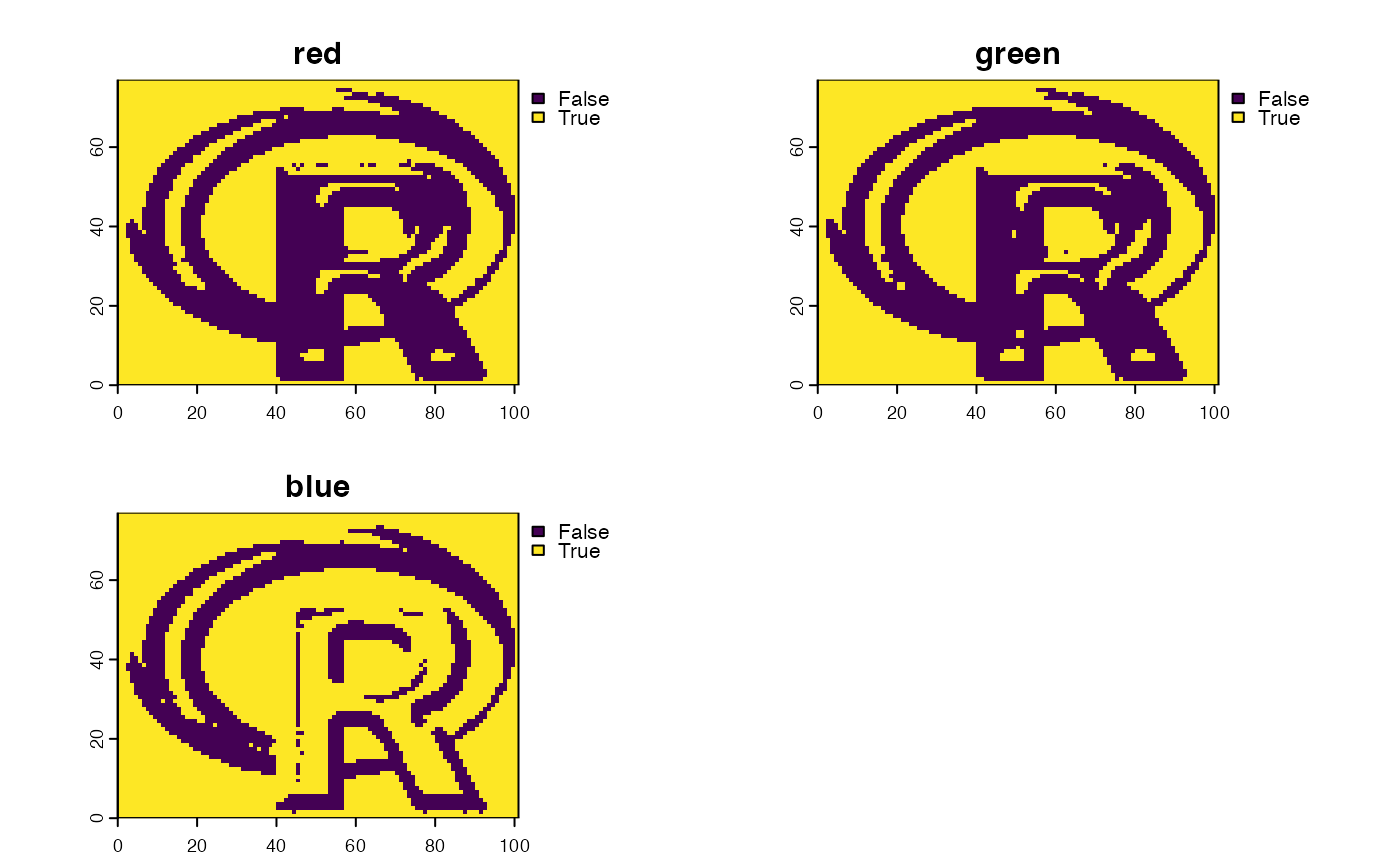
plot(thresh(s, "otsu"))