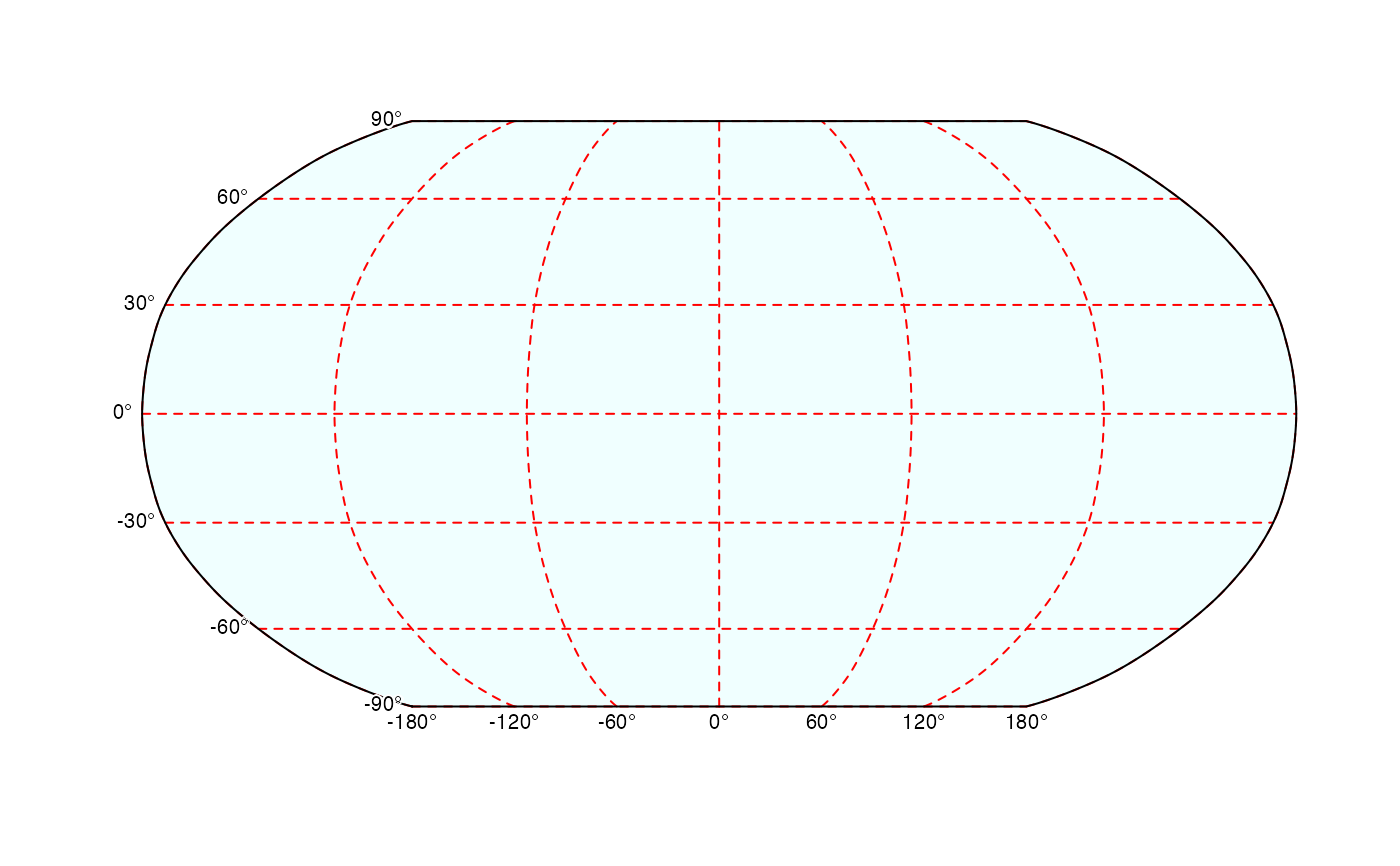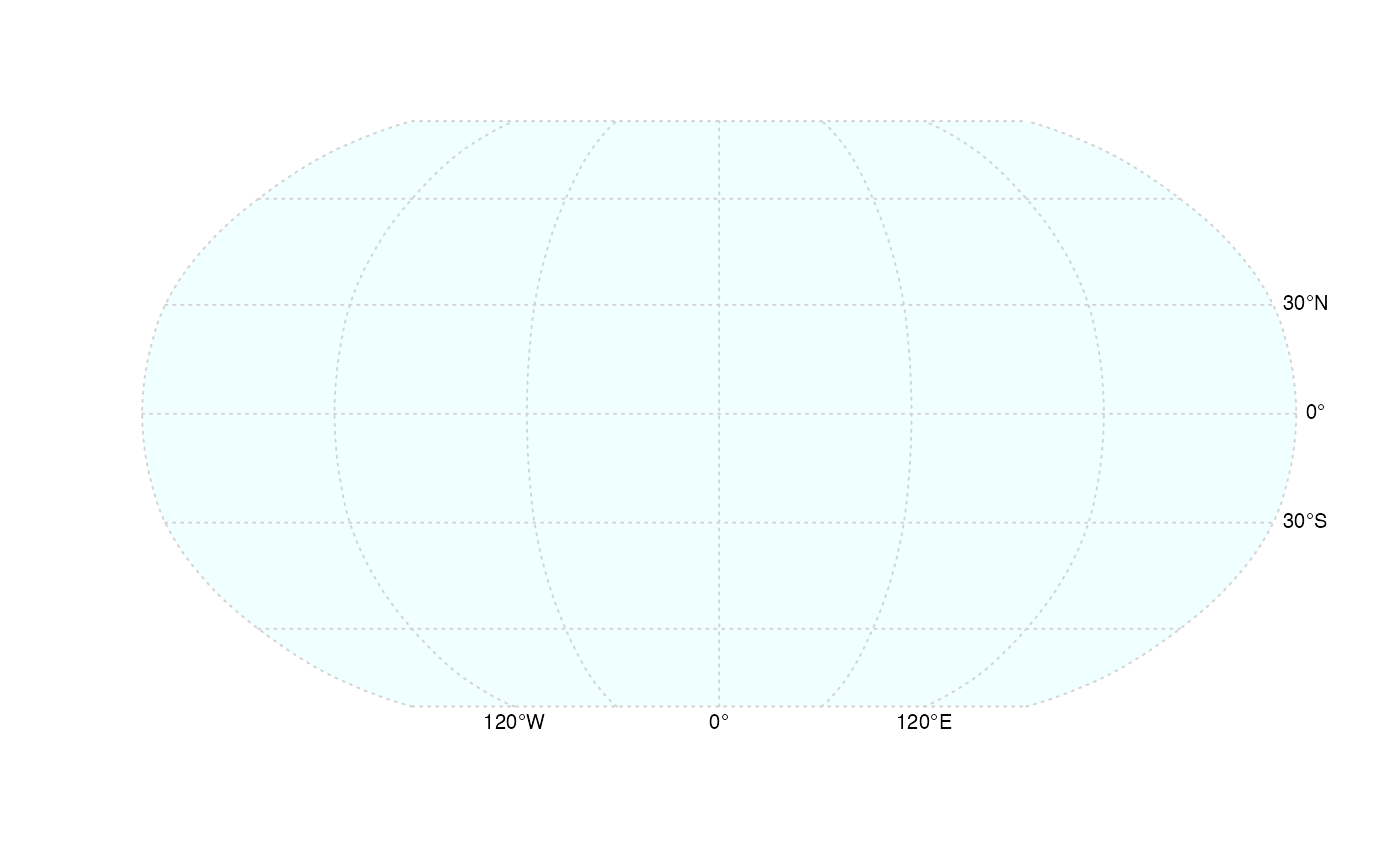
Plot a graticule
plot_graticule.RdPlot a SpatGraticule. You can create a SpatGraticule with graticule.
Arguments
- x
SpatRaster or SpatVector
- y
missing or positive integer or name indicating the layer(s) to be plotted
- background
background color. If NULL, no background is drawn
- mar
numeric vector of length 4 to set the margins of the plot. To make space for the legend you may use something like
c(3.1, 3.1, 2.1, 7.1). To fill the plotting canvas, you can usec(0,0,0,0. UseNAto not set the margins- col
character. Color for the graticule lines
- labels
logical. If
TRUE, show graticule labels- retro
logical. If
TRUE, show "retro" instead of decimal labels with the graticule- lab.loc
numeric. The first number indicates where the longitude graticule labels should be drawn (1=bottom, 2=top, NA=not drawn, any other number=top and bottom). The second number indicates where the latitude graticule labels should be drawn (1=left, 2=right, NA=not drawn, any other number=left and right)
- lab.lon
positive integers between 1 and the number of labels, indicating which longitude graticule labels should be included
- lab.lat
positive integers between 1 and the number of labels, indicating which latitude graticule labels should be included
- lab.cex
double. size of the label font
- lab.col
character. color of the labels
- off.lon
numeric. longitude labels offset
- off.lat
numeric. latitude labels offset
- box
logical. If
TRUE, the outer lines of the graticule are drawn on top with a sold linelty=1- box.col
character. color of the outer lines of the graticule if
box=TRUE- tickmarks
logical. If
TRUE, tickmarks are added- add
logical. Add the graticule to the current plot?
- ...
additional graphical arguments passed to
lines

