Add halo-ed text to a plot
halo.RdAdd text to a plot that has a "halo". That is, a buffer around it to enhance visibility.
Arguments
- x,y
numeric. coordinates where the text labels should be written
- labels
character. The text to be written
- col
character. The main color to be used
- hc
character. The halo color
- hw
numeric. The halo width
- ...
additional arguments to pass to
text
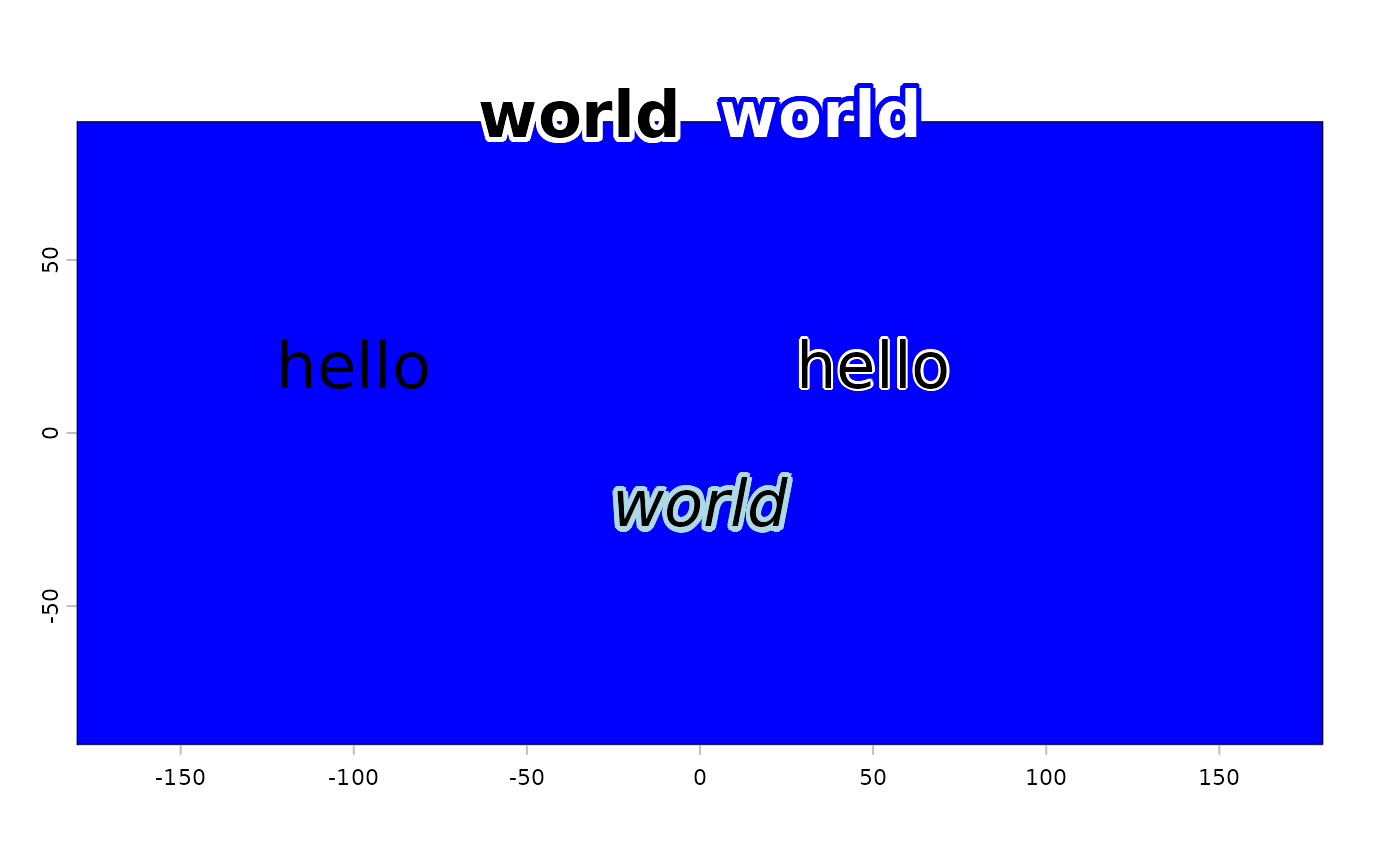
Examples
r <- rast(nrows=4, ncols=4)
values(r) <- 1:ncell(r)
plot(r, col="blue", legend=FALSE)

text(-100, 20, "hello", cex=2)
halo(50, 20, "hello", cex=2)

halo(0, -20, "world", font=3, hc="light blue", cex=2, hw=.2)
halo(0, 90, "world", font=2, cex=2, hw=.2, xpd=TRUE, pos=2)
halo(0, 90, "world", col="white", font=2, hc="blue", cex=2, hw=.2, xpd=TRUE, pos=4)