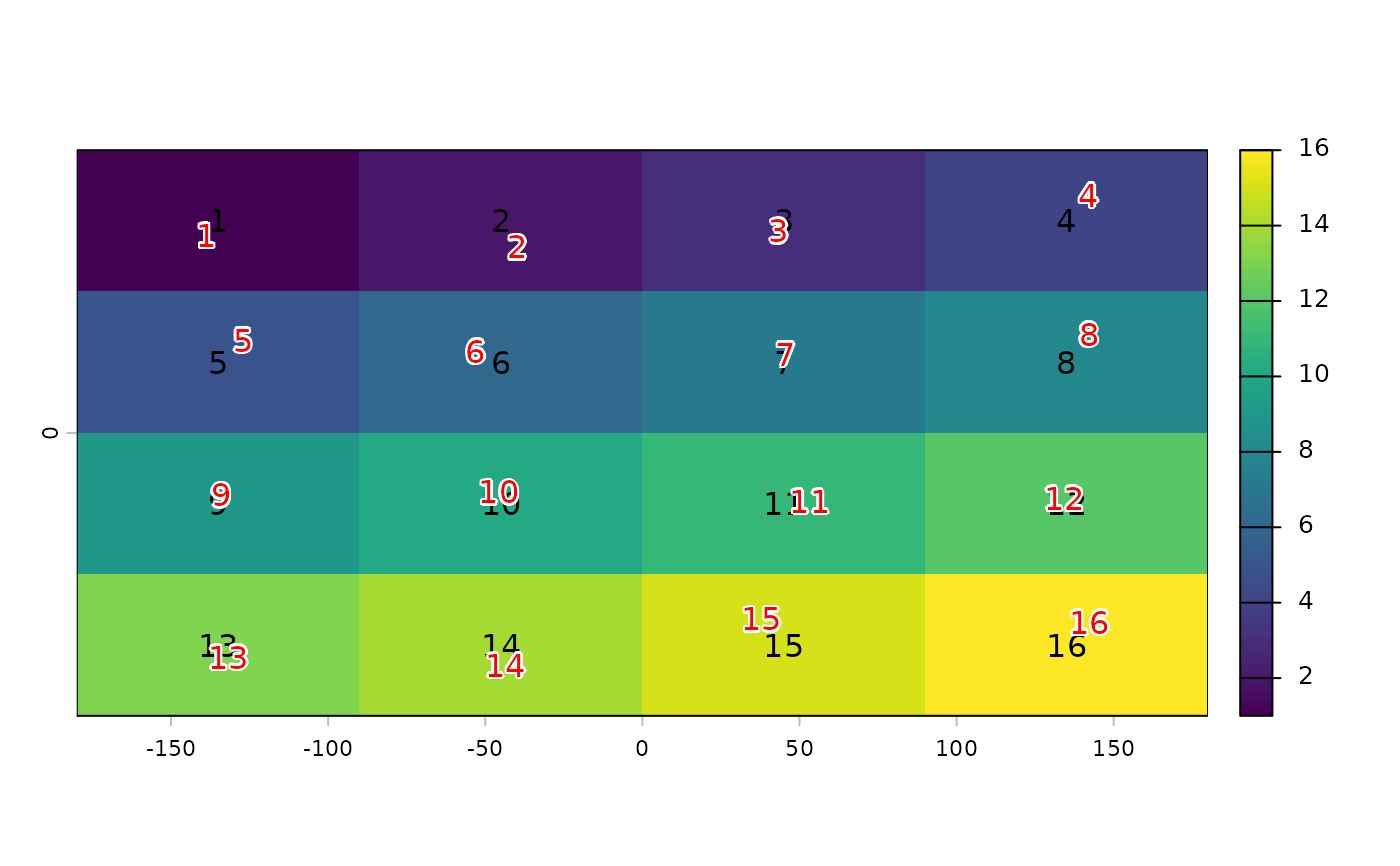
Add labels to a map
text.RdPlots labels, that is a textual (rather than color) representation of values, on top an existing plot (map).
Usage
# S4 method for class 'SpatRaster'
text(x, labels, digits=0, halo=FALSE, hc="white", hw=0.1, jitter=0, ...)

# S4 method for class 'SpatVector'
text(x, labels, halo=FALSE, inside=FALSE, hc="white", hw=0.1, jitter=0, ...)
Arguments
- x
SpatRaster or SpatVector
- labels
character. Optional. Vector of labels with
length(x)or a variable name fromnames(x)- digits
integer. How many digits should be used?
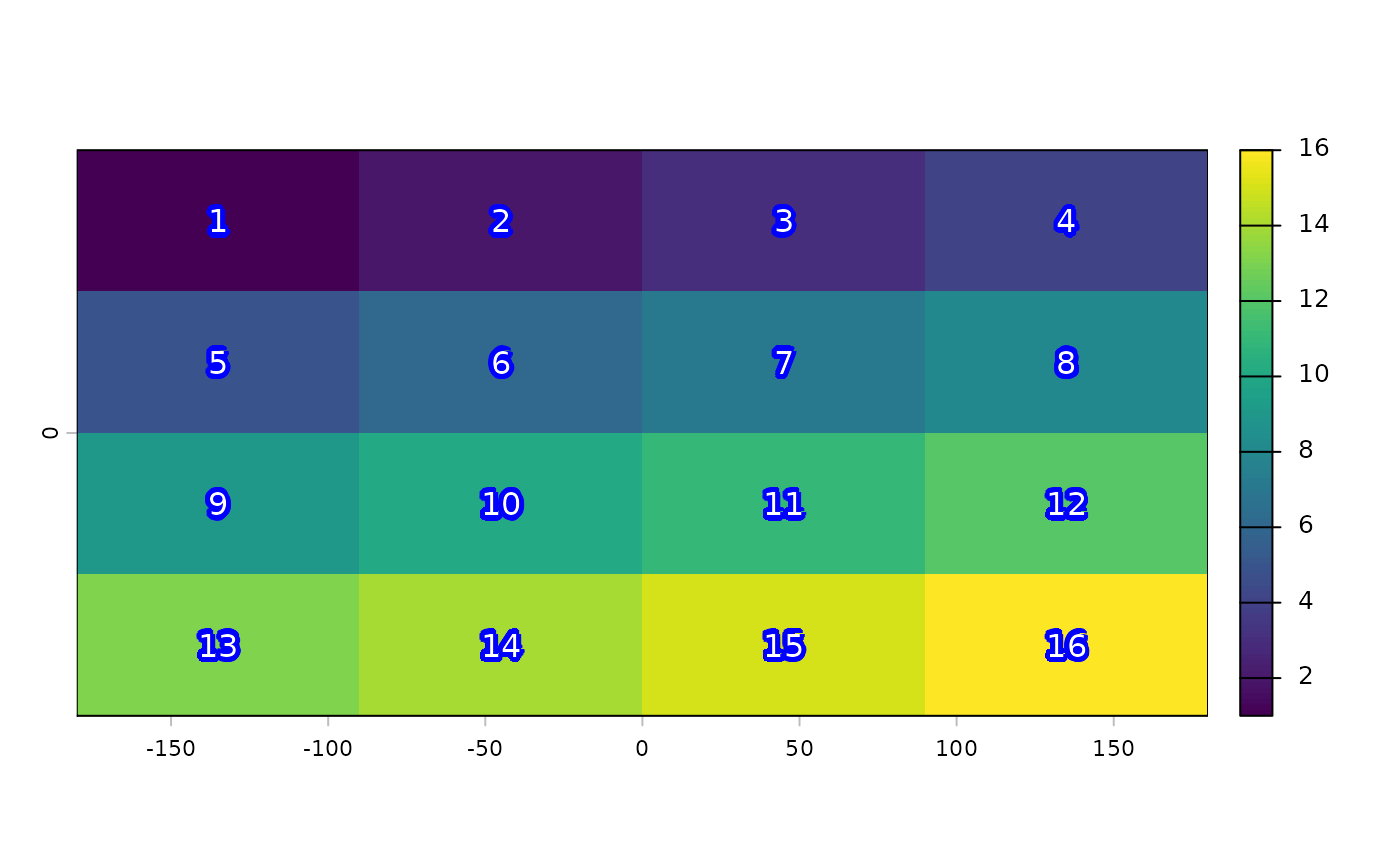
- halo
logical. If
TRUEa "halo" is printed around the text- hc
character. The halo color
- hw
numeric. The halo width
- inside
logical. Should the text always be placed inside one the sub-geometries?
- jitter
numeric. The amount of random noise used to adjust label positions, possibly avoiding overlaps. See argument 'factor' in
jitter- ...
additional arguments to pass to graphics function
text